
Tuesday, February 23, 2010
STEC Revisited
Bubbles will come and go with time as long as the stock market exists. The trick is to get out either before the bubble bursts, or soon after. STEC inc is a bubble. The bubble bursted September last year, and sell signals were literally on every technical indicator. For the longs that purchased at the high, it wasn't a mistake. There was nothing wrong with buying a stock at 52 week highs. Microsoft, Walmart, and Apple all reached where they are now by hitting 52 week highs. The mistake is not selling when the trend turned. Not every trade will be a win...some trade will be losses and it's crucial to understand when to get out. Even if you got out in the 20's, a 30-50% loss is better than selling it at a 80%+ loss after hitting <$10 in AH today. Another important point to be made here is to not average down. There's no sucker play like averaging down in a downtrend.

Monday, February 22, 2010
CAGC - SHORT @ 24.00 NEAR CLOSE
Parabolic move up = impending crash.
Short @ 24, targets @ $19.50, $16.

Short @ 24, targets @ $19.50, $16.

Saturday, February 20, 2010
Feb 15 - 19 Summary & Feb 22 - 26 Outlook
There were two key points that I have made in previous posts that I have put heavy emphasis on:
1. Do not expect a crash this soon. The market has risen above major resistance areas since the crash in 2008.
2. Beware of headfakes with the 20/50 EMA.
3. And more recently on 2/7, I suggested that the market will rise on low volume and the 20/50 EMA offered a good chance to release longs and initiate shorts or stay cash.
Indeed, the market rallied this week and the pull back since 1/20 stopped exactly at the 200 EMA mark. Early next week will be absolutely pivotal in determining how the entire month of March may play out because it appears this move may be a headfake to trap the bears who shorted on 2/16 and 2/17 at the 20, 50 day EMA.
Could this whole move during the past month be a headfake before SPX retests the 1,150 or goes even higher? First, the market indices have been above the 50 EMA for 3 days straight. Second, the EUR is getting oversold and fast approaching crucial support. A massive reversal in the EUR/USD pair will move US equities higher. The black candlestick on UUP looks very promising that equities could break out even higher on Monday as the UUP takes a break and retraces for a couple days. UUP also hit the 38.2% fib retracement from the 3/9/09 high to the 12/1/09 low. But make no mistake about it - the dollar is nevertheless in an uptrend and bullish, and will be a burden on equities.


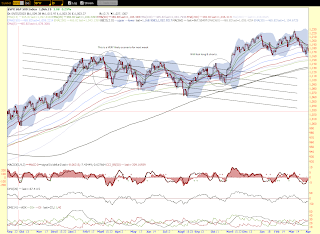
There are still many technical signs suggesting a continued downtrend based on the $SPX.
1. The 20 EMA is still below the 50, and this is a very easy way to flush out novice shorts or those without patience. The trend is still down. Remember Jul '09 when the masses wear bearish and though the head and shoulders would play out, only to be rejected by a massive move up. Guess what? The indices were all still in an uptrend. The exact same could happen now, except for the bearish/downtrend case.
2. CCI and DPO have not confirmed the up move. Both are still below the 0 line.
3. I drew three separate channels based on movements going as far back as Aug 2009 and Friday's close is close to the border on all three channels attempting to break to the upside. The more touches at the channel lines, the stronger the channel. In that respect, the black channel is the strongest followed by the blue.
5. Closed 1 point above the 50 SMA (even though i don't look too much into the SMAs they are occasionally valid).
There you have it - more technical reasons for the downtrend to continue as opposed to a possible headfake and new highs in the market. If the market breaks out Monday, become a bull again and expect at least a double top to 1,150. If the market stays flat and trades between 1,109 and 1,115, then hold onto shorts until the signal is clear. Trading is a business of probability and statistics - and right now the probability favors a continuation of a bearish move.

.PNG)
1. Do not expect a crash this soon. The market has risen above major resistance areas since the crash in 2008.
2. Beware of headfakes with the 20/50 EMA.
3. And more recently on 2/7, I suggested that the market will rise on low volume and the 20/50 EMA offered a good chance to release longs and initiate shorts or stay cash.
Indeed, the market rallied this week and the pull back since 1/20 stopped exactly at the 200 EMA mark. Early next week will be absolutely pivotal in determining how the entire month of March may play out because it appears this move may be a headfake to trap the bears who shorted on 2/16 and 2/17 at the 20, 50 day EMA.
Could this whole move during the past month be a headfake before SPX retests the 1,150 or goes even higher? First, the market indices have been above the 50 EMA for 3 days straight. Second, the EUR is getting oversold and fast approaching crucial support. A massive reversal in the EUR/USD pair will move US equities higher. The black candlestick on UUP looks very promising that equities could break out even higher on Monday as the UUP takes a break and retraces for a couple days. UUP also hit the 38.2% fib retracement from the 3/9/09 high to the 12/1/09 low. But make no mistake about it - the dollar is nevertheless in an uptrend and bullish, and will be a burden on equities.


There are still many technical signs suggesting a continued downtrend based on the $SPX.
1. The 20 EMA is still below the 50, and this is a very easy way to flush out novice shorts or those without patience. The trend is still down. Remember Jul '09 when the masses wear bearish and though the head and shoulders would play out, only to be rejected by a massive move up. Guess what? The indices were all still in an uptrend. The exact same could happen now, except for the bearish/downtrend case.
2. CCI and DPO have not confirmed the up move. Both are still below the 0 line.
3. I drew three separate channels based on movements going as far back as Aug 2009 and Friday's close is close to the border on all three channels attempting to break to the upside. The more touches at the channel lines, the stronger the channel. In that respect, the black channel is the strongest followed by the blue.
- Black channel dating back to Aug '09 - attempting to break back into this channel.
- Blue channel dating back to Oct ' 09 - right at the 50% mark.
- Red channel - most recent channel that the most subjective of the 3, and it looks like Friday's close could be the top of the channel.
5. Closed 1 point above the 50 SMA (even though i don't look too much into the SMAs they are occasionally valid).
There you have it - more technical reasons for the downtrend to continue as opposed to a possible headfake and new highs in the market. If the market breaks out Monday, become a bull again and expect at least a double top to 1,150. If the market stays flat and trades between 1,109 and 1,115, then hold onto shorts until the signal is clear. Trading is a business of probability and statistics - and right now the probability favors a continuation of a bearish move.

.PNG)
Tuesday, February 9, 2010
2/8/2010 - A look at the Euro
The Euro has been absolutely pounded because of the default fears over Greece and other European countries. This "crash" is reminiscent of the 2008 financial crisis, and as long as the Euro falls against the dollar, US equities will continue to fall. What's troubling is that the eur/usd chart has broken the 360 MA. However, I do see a temporary bottom based on the reversal candlestick pattern, and we could see a sharp rally to re-test the 50 EMA soon. This would give a chance to dump long positions.


Sunday, February 7, 2010
Selling the next bounce
Market decided to rally shortly after touching the 200 day EMA, giving a long tail on the candlestick formation otherwise known as the hammer. The hammer is bullish, so I am expecting a higher chance that the earlier part of next week to be up days with light volume. Any upcoming rallies will be opportunities to sell existing longs (keep a couple strong positions like AAPL, GNW, etc) and establish SMALL short positions or just STAY CASH. The SPX has crashed through major support at 1,115 and 1,085, and these will now become key resistance areas.

There's a couple reasons on why it's crucial to scale in small short positions or stay cash.
1. This a fakeout before reaching new highs. In this case cover shorts as soon as the 50 EMA does not hold.

2. Worse yet, consecutive fakeouts while the market trades within a channel. This occurred in 2004 as the US emerged from the 2000 - 2003 recession. This zig zag scenario is a very likely for 2010, but no way to be certain. Trading this kind of a market is extremely difficult, as it takes both patience and additional forms of analysis. By strictly using the 2050 EMA rule, your account would take considerable hits from the fake outs. Nevertheless, it still can be done.
- The safest way to play this is to not play it at all - stay cash, or invest in stocks with great fundamentals and sell covered calls.
- Use channels once the first high/low swings are formed. Sell/buy according to the top/bottom of the channels. If the shorting at the upper channel and movement pierces to the upside, cover immediately. Vice versa.
- Use the 20/50 EMA rule, but enter positions strictly at the 20 or 50 EMA during the BACKTEST after a trend break. Get out immediately if the position doesn't go your way. Wouldn't recommend holding more than 2-3 days.
- Out of the 3 options, I believe staying cash or selling covered calls will be the best play.

Friday, February 5, 2010
2/5/2010 - Noon Report
Market selling off on HIGH volume. Big players want to get OUT. Hedge funds are SELLING. Do not think this is just another dip. The trend has already reversed.
Remember:
1. Don't catch a falling knife. Every bounce so far has been sold off.
2. Do no average down in a downtrend.
3. If you absolutely must enter a position, do it at the end of the day, minutes before the close.
4. OVERSOLD CAN BECOME EVEN MORE OVERSOLD.
You do not want to be the bag holder weeks or months from now. More updates to come after market closes.
TREND REVERSAL
Thursday's action has officially put an end to the uptrend. 20/50 EMA cross over, VIX crossover, SKF and short ETFs broke out decisively from the 50 EMA.


Monday, February 1, 2010
U.S. Steel (X) - Short at $55
X is a great trading vehicle, and it looks to be the high has been put in for the year, unless it can break and hold $55. X is heavily damaged from last week's high volume sell off, and I believe it has more room to go down. Wait for the gap fill at $55 to short, although entering at $54 may not be a bad idea. $43 will be key support so pay extra attention to that area. Weekly chart suggests a right shoulder may be forming. If $43 breaks, target to cover will be in the low 20's.


SPX - Bearish
Bulls were crushed last week on high volume as basic materials and tech retraced hard. The downtrend is almost confirmed - wait for the major indices to retest the 50/20 EMA and sell half of long positions and use those funds to add to short positions. The trend has been severely damaged and I do see a continued sell-off to anywhere from 970 to 1050 once the 20/50 EMA is tested. Do not be attached to any stocks. It's time to take profits since the trend confirmation from April last year.


Subscribe to:
Posts (Atom)
